
Shortcuts, Table And Chart Tips And Personal Finance Management In Microsoft Excel – Tech Tip for June 9, 2020
Continuing with our June theme of getting to know the other 90% of the Microsoft Office 2019 features that you are missing out on, here are some Excel tips, tricks and hacks. Try them out and impress your colleagues on your Excel wizardry.Continuing with our June theme of getting to know the other 90% of the Microsoft Office 2019 features that you are missing out on, here are some Excel tips, tricks and hacks. Try them out and impress your colleagues on your Excel wizardry.
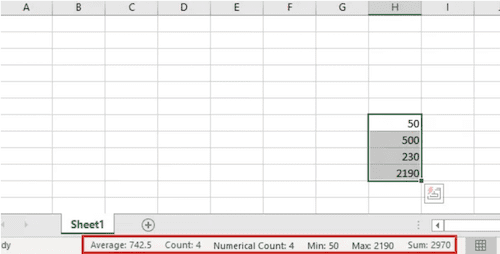
Get More from the Status Bar
Many people know about the status bar in Excel, where you can find the sum, the average, and the total count of numbers, but did you know that you can right click it to add more features? For example, you can add the minimum and maximum values in a range.
Quickly Navigate using Keyboard Shortcuts
If you need to navigate through a sheet quickly, you can use the following keyboard shortcuts.
- Ctrl+End – navigate to the furthest right cell that has entered data.
- Ctrl+Home – navigate to the start.
- Ctrl+right arrow – navigate to the furthest right of the Excel sheet.
- Ctrl+left arrow – navigate to the furthest left of the Excel sheet.
- Ctrl+up arrow – navigate to the top of the Excel sheet.
- Ctrl+down arrow – navigate to the bottom of the Excel sheet.
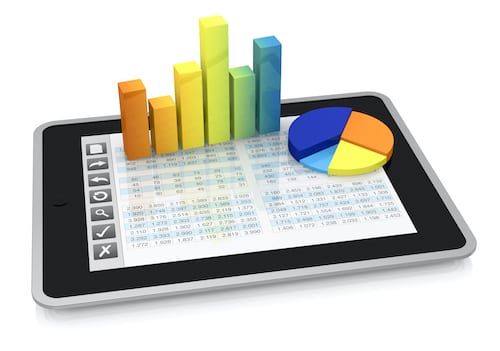
Make Your Data Pretty with Tables and Graphs
You can create visually appealing tables in seconds by following the steps below.
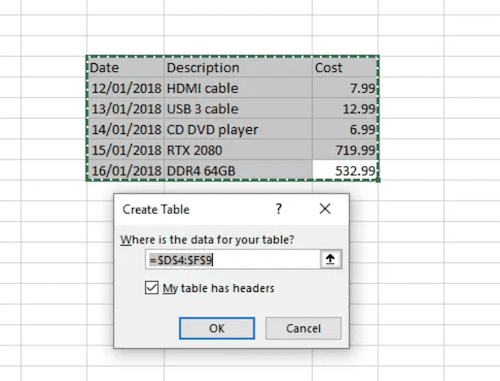
- First, highlight the data you’d like in the table.
- Go to the Insert tab.
- Click Table.
- The highlighted area will now have a border around it.
- Click OK to create the table.
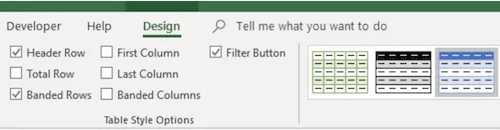
You can use the table icons at the top right to change the colors, and use the checkboxes under the design tab to change up the layout.
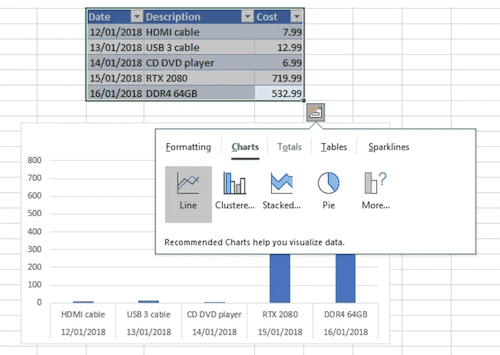
You can also click the small icon underneath the table once your cursor is hovering over the table. This will open a small menu for creating charts, tables, formatting rules, and more.
Manage Your Finances Using Excel
Money in Excel is a premium template coming soon to the Microsoft 365 Family and Personal editions of Excel (not the Professional, Business or Enterprise Editions). Money in Excel is a dynamic template for Excel that can help you manage your money. It’s the only template where you can securely connect your financial institutions to import and sync account and transaction information into an Excel spreadsheet. Track all your finances in one place, customize your workbook, and receive personalized tips without ever leaving Excel. Learn more about Money in Excel here.
Need additional support with Excel? Refer to Microsoft’s Excel Help & Learning page.