
Powering Your Business With Power BI – Tech Tip for March 2, 2021
This month our Tech Tips are going to cover Microsoft’s Power Platform which includes Power BI, Power Apps, and Power Automate. These three technologies can be used individually or together to create solutions to help your business work better. First up is Power BI – it is the analysis and insights component of Microsoft’s Power Platform.
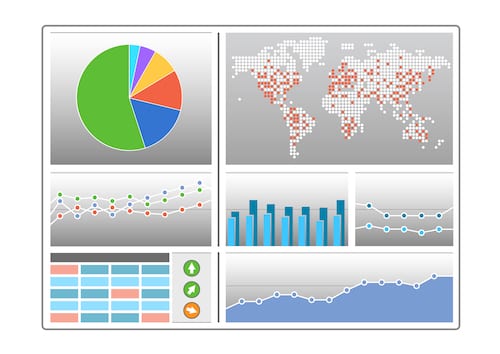
Power BI is used to turn data into coherent, visually immersive, and interactive insights. Your data may be in the form of Excel spreadsheets, exports from a CRM or ERP system or a collection of databases. Power BI lets you connect to your data sources, visualize the data, and share it with anyone. With the right implementation, Microsoft Power BI can be a powerful tool for creating actionable and insightful information that guides an organization’s strategic and tactical business decisions. The below video shows some of the analysis and reporting that is possible with Power BI:
What Can Power BI Do for Your Business?
- View key performance indicators and metrics at a glance, facilitating fast decision-making.
- Create dashboards to visually demonstrate performance against KPIs and business goals.
- Transform raw data, such as disparate spreadsheets, into meaningful insights.
- Create interactive reports customized for your business.
- Collaborate and build reports with colleagues.
- Take advantage of the latest advances in Microsoft AI to prepare data, build machine learning models, and quickly find insights from both structured and unstructured data.
- Access data from anywhere on any device, including mobile phones.
Examples of Problems that Can be Solved with Power BI
- Visualize data from your financial system such as QuickBooks. Even if your current financial system does not offer any charting capabilities, data can be exported and turned into useful charts. For example a financial performance dashboard, customer spend chart or an accounts receivable (AR) report.
- Gain better insight into your sales pipeline data by visualizing your opportunities, customer interactions and deal timelines.
- Bring all of your human resources data together from your payroll system, time entry solution, survey solution and more.
How to Get Power BI
Microsoft Power BI is available as a cloud-based subscription. It can be added as an additional subscription to your existing Microsoft 365/Office 365 tenant. It is also included in the Microsoft 365 E5 subscription.
Here’s a short video to learn more: